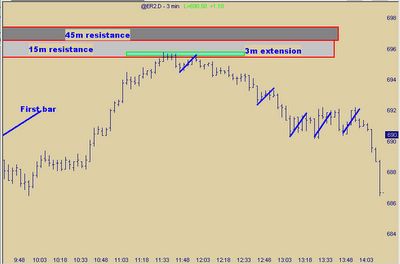
In order to keep order in my trading instead of scanning 8 time frames, is that I subscribe to CB and have since about the time she started doing this work. It took me a while to really get a hang of it, but now can't trade without it. However, I always had problems with looking at a bunch of charts, so by hand, I draw the symmetry, extensions, resistance and support clusters from the higher time frames down onto my trade setup chart. Take this chart as an example, I can clearly see by doing my charts this way, that around the 696.00 area we could stall. Now, I would never suggest just shorting there for any reason other then be a gambler, but once symmetry was broken, then that is another story. I drew several retracement lines in blue, and around 1:00 to 2:00 the market was going sideways to say the least. But the idea of symmetry was holding, both CB in her chat room and MarkB in the FibonacciTrader.com chat room this week talked about this. So you didn't want to be a buyer and if there was a short setup, what was the one to consider, not because it worked here, but because the odds are it will work a high percentage of the time.


No comments:
Post a Comment